
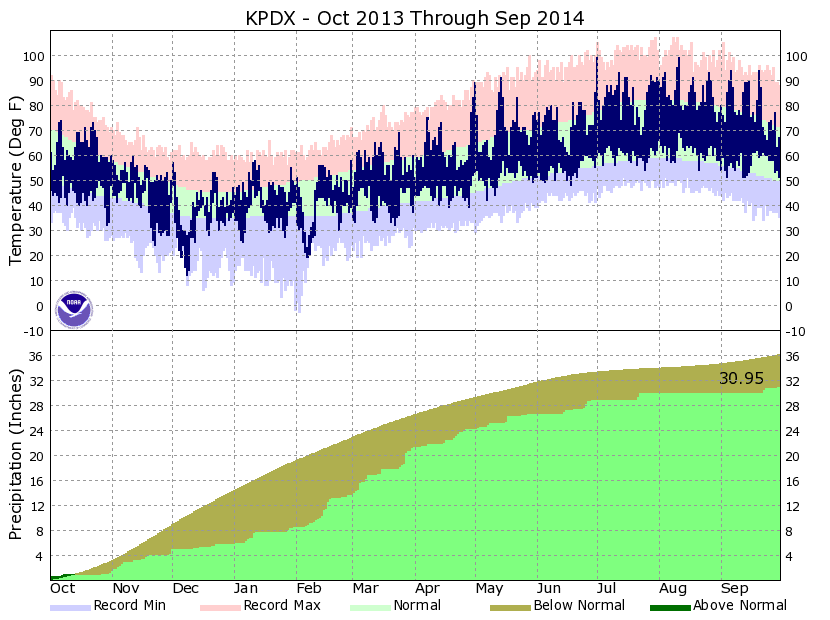
Two weather graphs of the fateful, for my Fascicularia pitcairnifolia, winter of ’13-’14. Showing our typical spiking pattern of temperatures with two abnormally cold periods. The lower graph shows the years accumulative percipitation, 5″ below ‘normal’. In contrast through July of our current rain year we have received around 57″ in inner SE Portland, about 23″ over normal. The time period is our ‘rain year’ measured from Oct.1 – Sept.30 beginning in the fall after our typical summer ‘drought’ period.
