
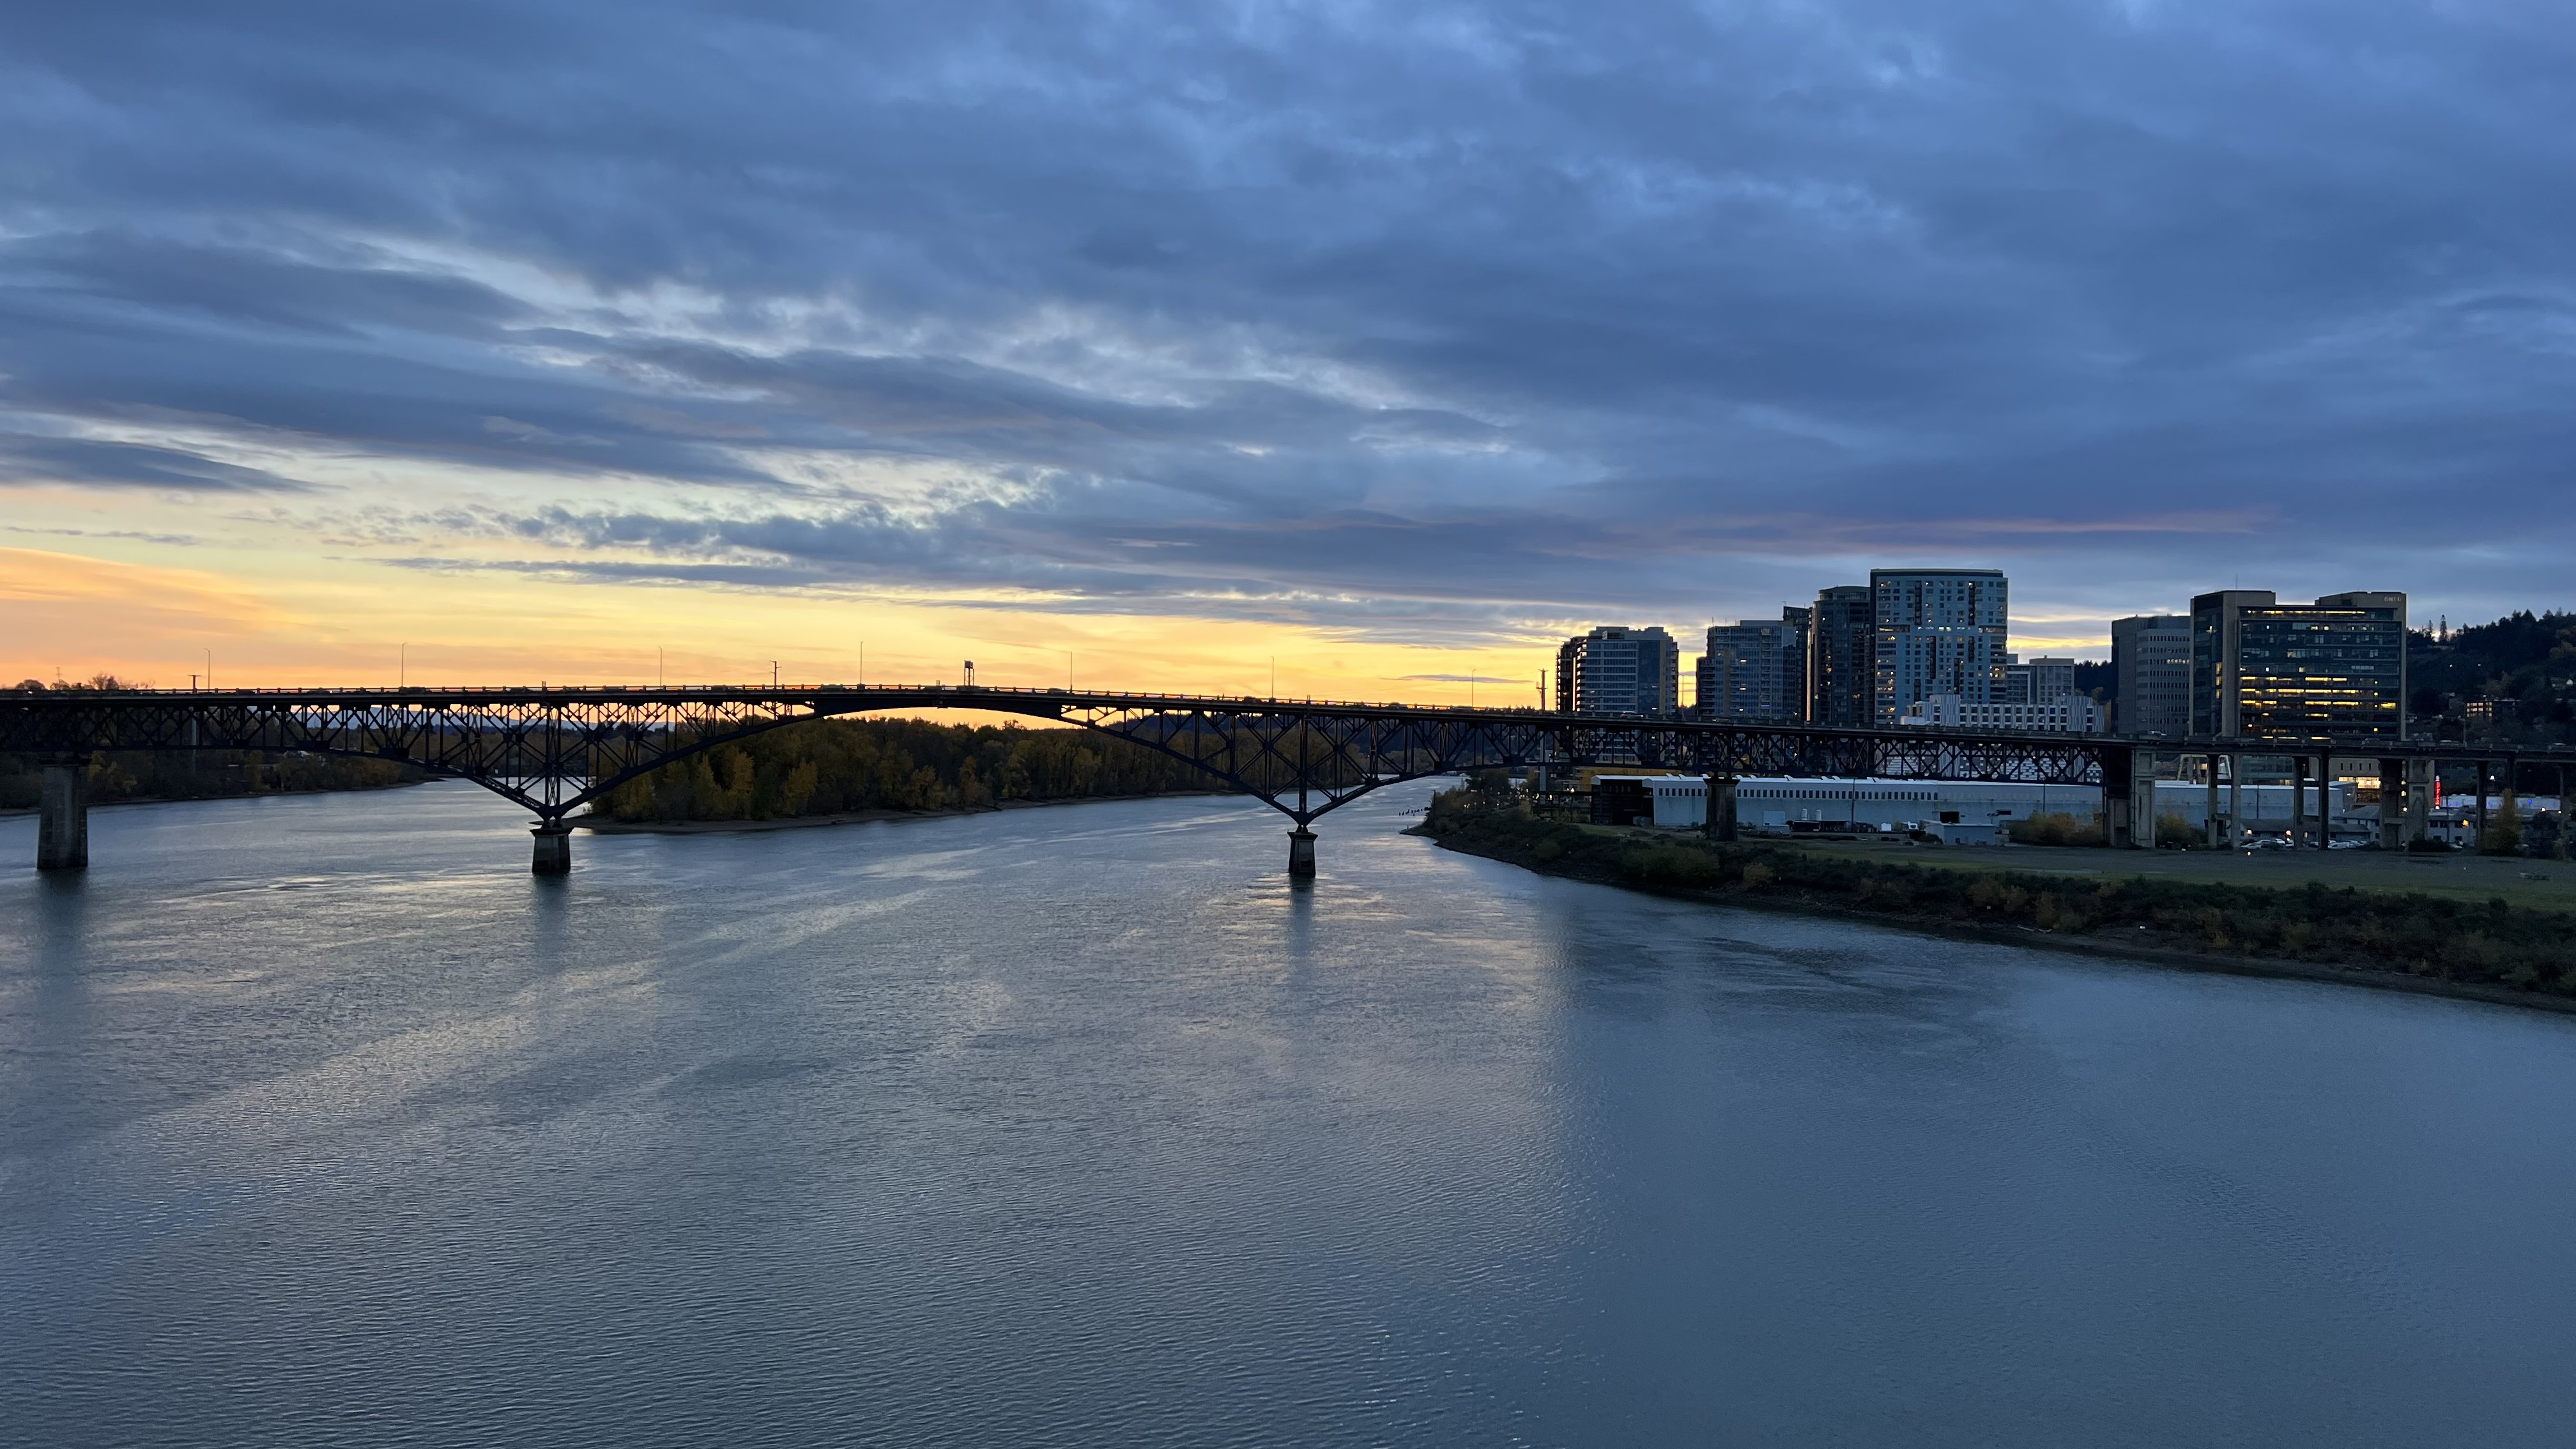
Looking south, upstream along the Willamette, to the Ross Island Bridge and the South Waterfront buildings hugging the western bank which house the pool in which I swim..
I puttered and pruned in the garden today until I produced enough waste to fill my yard debris wheelie bin, it didn’t take long. After lounging around and reading for awhile I walked the 2 and 3/4 miles to the pool at OHSU where I swam for 40 minutes, then spent another 1/2 hour doing yoga and some core exercises in my efforts to slow down my inevitable decline…then, I walked back home across the river. It was a bizarrely warm afternoon, and early evening, and I covered the distance in a tee shirt…and pants and shoes of course. Lots of walkers out crossing the Tilikum Bridge and walking along the river. People were taking advantage and enjoying the day. I wonder how many understand just how ‘weird’ this weather is?
We moved to Portland early in the fall of ’85. If you look at the records you’ll see that that Thanksgiving time was notable. Yesterday, Nov. 28, 2021, we had an official low of 53º and a new record high for the day of 63º. Check out these temps and consider that our ‘normal’ lows for the period are 40º-37º, our highs 51º-48º:
Nov. 19, 1985 we had a low of 37º; on the 20th, our lows began to drop and we hit 32º; on the 21st, we dropped to 27º; on the 22nd, 21º with a high of 30º; on the 23rd, 17º with a high of 26º; on the 24th, 14º with a high of 25º; on the 25th, a low of 20º with a high of 29º; on the 26th, 25º, later warming above freezing to 40º; then back down, on the 27th, 26º and 38º; on the 28th, 21º with a high of 27º; on the 29th, 21º and 26º; on the 30th, 22º and a high of only 25º; on Dec. 1, another day that ranged only three degrees, this time from 21º to 24º; finally, on Dec. 2, the cold spell began to break with a low of 23º warming all the way up to 43º.
That period in 1985 was a record breaking onslaught, 13 consecutive days with lows below freezing; eight of those with highs below freezing. At the time I was a little surprised, but was used to such temperatures having lived so many years previously in Central Oregon where these were common and far from record lows. It would take me several years to understand how strange this period was. If you look at the record daily lows for this period you would see that 7 of them are still standing from this period, 36 years ago. You may not think this particularly cold given the severity of climates elsewhere, but climate, and its extremes, cannot be considered separately from place. Extremes are then relative and they will ‘test’ the several thousand species that are adapted to a place. We need to remember that unlike us most other species are closely tied to their place of origin.
Formal record keeping didn’t really begin until 1871 here, so our records only go back 150 years. I tend to use 1985 as a benchmark when thinking about our weather, a period that’s just shy of 1/5 of the modern record keeping era. If temps weren’t trending warmer or colder, if you had data from a long enough period, longer than that which we have for here, records would show an even ‘scatter’, over time temperatures would cluster around the normal range with a more or less equal distribution. As the years pass, fewer ‘new’ records would be set and those that are would be marginal changes. True there are longer cycles in effect, but they wouldn’t result in significant and quick changes, like our 116º record high set last June, nine degrees above the previous record. The following survey of Portland record highs and lows show a pattern.
Daily record temps. for each month.
Dec. – 14 of the record lows occurred on or before 1985; 14 of the record highs occurred after
Nov. – 26 of the record lows occurred on or before 1985; 19 of the record highs occurred after
Oct. – 22 of the record lows occurred on or before 1985; 17 of the record highs occurred after
Sept. – 27 of the record lows occurred on or before 1985; 15 of the record highs occurred after
Aug. – 30 of the record lows occurred on or before 1985; 16 of the record highs occurred after
July – 28 of the record lows occurred on or before 1985; 14 of the record highs occurred after
June – 28 of the record lows occurred on or before 1985; 18 of the record highs occurred after
May – 28 of the record lows occurred on or before 1985; 18 of the record highs occurred after
April – 26 of the record lows occurred on or before 1985; 22 of the record highs occurred after
March – 29 of the record lows occurred on or before 1985; 18 of the record highs occurred after
Feb. – 13 of the record lows occurred on or before 1985; 14 of the record highs occurred after
Jan. – 28 of the record lows occurred on or before 1985; 16 of the record highs occurred after
299 of 365 daily record low temperatures here were set on or before 1985, 82% of the total. 18% have been set since 1985. Most daily lows occur between the limits already set.
In contrast 201 of 365 daily record high temperatures here have been set since 1985, 55%, just over three times the daily cold records set over the same period, again 1/5 of the time we have records for! Were the climate stable the rate of occurrence of new records, highs and lows, would be the same…and declining. Climatologists are noting similar patterns around the world, as they examine the records being set for new high ‘lows’, our night time temps warming. Most areas are experiencing increasingly warmer averages at every scale, daily weekly and monthly. Critics attempt to maintain that the occurrence of average or colder temps for lows on given dates as a refutation of global warming. ‘See! It isn’t warmer!’. The same for just about anytime it feels cold to them outside or that it snows. They don’t understand the data…and they aren’t interested in any explanation. They scoff at the science when critics claim that a 2ºC rise in average global temperature above the historic pre-industrial levels, means anything at all, using their own ignorance of biology, ecology and systems science as a defense, simply dismissing the data and claims. Their ‘faith’, I fear, will prevent their understanding and acceptance, at least until the damage manifests in such a way that it effects them directly.
Our coldest records, single digit and below, of which there are only 4 in the month of February, 10 in the month of January and 5 in the month of December, all occurred on or before 1972 with one exception, the low of 9º on Feb. 5, 1989. I experienced that here and it too was bracketed by other exceptionally cold temperatures that were somewhat ‘warmer’ than the record lows on their dates so they don’t show up in the daily records. This arctic outbreak was associated with devastating cold weather that dropping down out of Canada spread throughout all of the northern states. Often times during these events we are spared the cold held back the north south spines of the Rocky Mountains and Cascades. On these dates, however, the drop began on Jan. 31 with a low of 35º the day having reached 50º. The next day, Feb. 1, the cold period began to set in in earnest, 20º-34º. Feb. 2 registered a low of 12º and a high of 18º; Feb. 3 a low of 9º and a high of 14º; Feb. 4 a low of 14º and a high of 27º; Feb. 5 a low of 9º again recovering to a high of 38º; then on Feb. 6 dropping back down to 18º before rebounding to 40º; Feb. 7 saw al low of 23º and a high of 39º. The 8th hit a low of 26º and high of 42º. On the 9th it was 29º and 46º and on the 10th, 31º and 36º. Eventually, on the 12th our low rose a bit above freezing. When winter systems align arctic air can pour into Portland and south through the Willamette Valley.
This is a common pattern for our region, bunching our coldest temperatures in otherwise relatively mild periods…and they can be devastating for plants of marginal hardiness, more so when they come quickly on the ‘heels’ of a mild period and extend over several days. Cold damage can be catastrophic when drops are sudden and extreme, but damage can result also as less severe freezing days accumulate, one following after the other, the cold penetrating soil and tissues progressively.
Despite these arctic blasts our Portland area records demonstrate a gradual warming, our most extreme cold records happening in the freakishly cold year of 1950. A perusal of the records from then shows that ‘arctic’ period stretching from January 12 all of the way through Feb. 5, three weeks, before we escaped from its frigid ‘grip’. It was an historic and truly extraordinary period beginning with lows and highs of 14º-35º on the 12th, with many days recording freezing highs as well. Jan. 13, 14º-34º; Jan. 14, 11º-22º; Jan 15, 21º-35º; Jan 16, 9º-20º; Jan 17, 8º-22º; Jan. 18, 14º-22º; Jan. 19, 19º-29º; Jan. 20, 28º-34º. This ‘first’ period was interrupted by a briefly before it would return.
On the 21st temperatures dropped only to 34º. On the 22nd the low held at 38º. Then on the 23rd it dropped to 30º and began a more serious sustained drop. On the 24th Portland recorded 19º-31º, then on 25th a more significant drop, 12º-26º; Jan. 26 it wavered, 22º-36º; Jan. 27, 18º-22º; Jan. 28 , 11º-25º; Jan. 29 9º-20º; Jan. 30, 11º-25º; Jan. 31, (-2º the coldest temp ever recorded in Portland)-15º; Feb. 1, 2º-24º; Feb. 2, (-1º)-18º; Feb. 3, 8º-19º; Feb. 4, 18º-29º; Feb. 5, 26º-36º. There have been many similar periods occurring every few years with several notable ones such as in 1943 and 1974, and the one I began with in 1989, but none of such severity and duration. Cold records will likely continue being set, but they will be becoming increasingly rare. Records are not the entire story here,
There are many patterns that strongly suggests a change. Polar ice is melting. Glaciers and the Greenland ice cap are retreating rapidly. The oceans are rising threatening coastlines and low islands. Record high temps are being set at an accelerating rate around the world, particularly in the equatorial regions, but not there alone as evidenced by last June’s heat dome in the Pacific Northwest and Portland’s 116ºF record that surpassed our old record by 9º. Reservoir levels across the west dropped over the summer and extended drought to all time lows and aquifers are being drawn down at an accelerating rate, while river flows lower and their temps rise, in many cases effecting fish runs and the lives of many aquatic species. Meanwhile storms are growing in intensity and frequency. Rain patterns are shifting putting agriculture and undisturbed landscapes alike under stress, some areas suffering in increasing frequency of heavy rains while others suffer drought. Massive fires are becoming the norm across the west. Corals of the several barrier reefs and ‘defending’ many of the Polynesian Islands are dying. Scientists are beginning to find that the changes, as small as they may seem, are already effecting the dates that plants flower, and insect eggs hatch, presenting potentially catastrophic issues for pollination and the survival of species, plant and animal alike. Some of the links between species, adapted one to the other, are beginning to experience a disconnection. As heat puts more species under stress, the incidence of disease are expected to rise. Understandably, it is not surprising that many people would want to deny or ignore what is going on…but that simply wastes the time we have to dial back the negative impacts we can which will forestall or at least soften the severity of coming changes.
Giving equal ‘weight’ to our entire recorded weather history can ‘muddy’ our view of these trends. Climatologists claim these are accelerating…and evidence is being demonstrated in the data. To see this more clearly they tend to watch temps recorded over the most recent 30 year period, this evens out some of the aberrations while more clearly displaying the changes. Take the month of June for example, only one daily record low was set in the last 20 years, 45º on June 8, 2002, while fourteen days recorded their record highs. Now let’s look at January, the month we experienced our record coldest day of -2ºF on the 31st of 1950, three record cold temps were set in 2017. We all remember that month.

Pay particular attention to the bars showing the temps from the first half of the month.
No other records were set over the last 20 years. On the 5th of that year, we hit 17ºF, on the 13th, 11º followed by 19º on the 15th. Only eight days that month had lows above freezing, the highest reaching just 37º. That was an anomaly in a trend that overall has been warming. Nineteen of the last January’s have occurred within all previous set limits. Even with that extreme of 11ºF Portland is solidly within the USDA growing zone of 8a. Averaging our lowest annual temperature over the last 30 years, it has risen to 21.3ºF. We have entered the USDA zone 9a! Again, these are average that show trends, not absolute limits. We will get more anomalous periods such as the winter of ’17, but overall our minimums are warming. We will continue having significant arctic blasts every few years, but these too seem to be warming.
Similarly, summers will keep trending warmer with record highs scattered around the calendar along with a gradual increase to our nightly minimum temps. This will not be an even progression. Climatologists expect increasingly chaotic patterns with radically warmer periods balanced out somewhat by cooler temps. Climate and weather are dynamic complex systems responding to many variables making the future difficult to predict with accuracy, but trends take on a kind of inertia of their own and we can expect the changes to continue.
Portland has seen the arrival of many new residents from outside the region drawn here for our climate, our diverse landscapes and the culture of our city. Like me they came here largely ignorant of what is normal, of this place’s history and what the changes might mean. Over time they will gain a better understanding if they are open to it. But the changes are happening at an accelerating rate and what they come to see as normal will not be what it once was and when we speak of that in terms of climate and biology that puts them in a difficult position when it comes to understanding what to do about it. Many people were out today reveling in the warm weather, the break in the rain, unaware or unconcerned with what that means here. I did the same in the garden and on my walk across the river and back.
Please check out Paul Bonine’s postings on Xera Plants blog. Always good, like this one on the warming of the Portland area to USDA zn9a.
